
Step 4: Massage the Numbers
You own the data. Make it tell the story you want it to tell.
At a town hall meeting on 9/30, where he addressed students, faculty and alumni, President Ayers was asked to explain why the University couldn’t bring on men’s varsity lacrosse as an additive sport, without having to drop the men’s soccer and track programs.
Ayers cited several reasons:
One, under title IX the University would have to bring on more women’s varsity sports to balance out the addition of men’s lacrosse.
Two, the University would exceed the magic number of 13% athletes to total students. Ayers went on to say that with 13% athletes, Richmond has one of the highest percentages of athletes to students among the schools it competes with for students. Technically, Ayers’ statement is accurate. Below is a list of universities, pulled from the U of R website, with whom the University of Richmond ‘competes for students.’
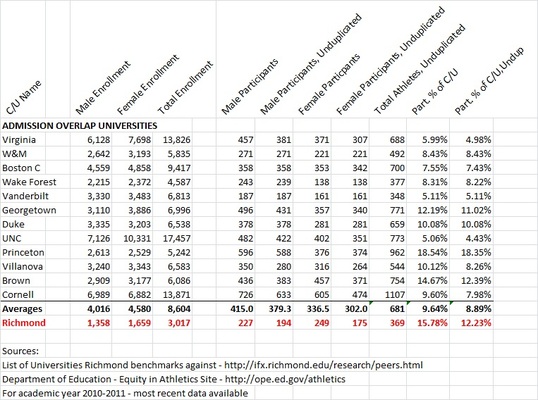
It’s clear, however, that these universities are much larger than the University of Richmond, averaging 8,604 students to Richmond’s 3,017 students. Of course they are going to have a lower percentage of athletes to total students; they have over 2.5 times the number of total students.
There’s another list of universities against which the University of Richmond benchmarks itself. The list is also on the University’s website and includes small, private, academically rigorous universities. See list below:
There’s another list of universities against which the University of Richmond benchmarks itself. The list is also on the University’s website and includes small, private, academically rigorous universities. See list below:
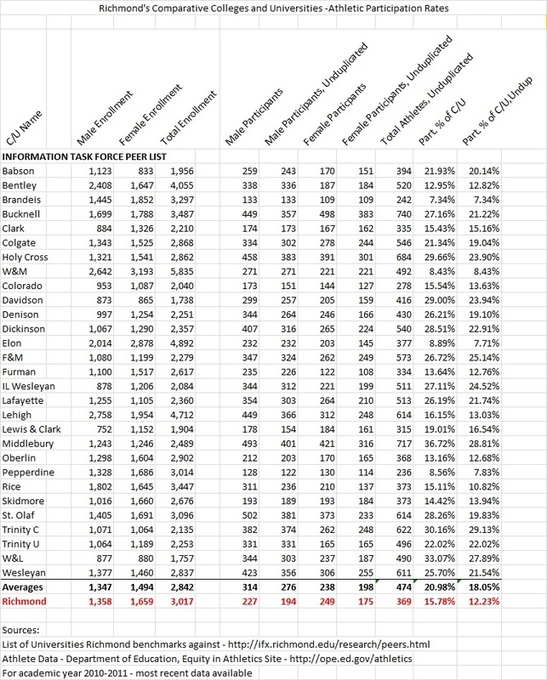
With roughly the same number of total students as Richmond, and a similar academic profile, this is the list that Richmond should benchmark itself against athletically. What is the average percentage of athletes to total students at these schools? It’s 18.05%, compared to Richmond’s ratio of 12.23%. So, in fact, Richmond has one of the lowest percentages of athletes among the universities it benchmarks itself against.
When Lori Schuyler got wind of this analysis, she was quick to point out that many of the universities on the list of 29 that Richmond benchmarks itself against are Division 3 schools. As such they do not offer scholarships, and therefore, it’s not a fair comparison.
Fair enough. Let’s only include the Division I schools among the list of 29 universities against which we benchmark ourselves. Subtracting Division 3 universities from the list, you are left with 10 Division I schools. The average enrollment of these 10 Division I schools is 3,200 students; that’s almost exactly the same size as Richmond. What’s the average percentage of athletes to total students among these 10 Division I schools? It’s 16.2%, compared to Richmond’s 12.23%.
This is a classic case of massaging numbers and telling half-truths to support a decision that had nothing to do with athlete to student ratios.
Massaging the Numbers – Extra Credit
On 10/7 parents of the Richmond soccer players were given a chance to question President Ayers and his Chief of Staff, Lori Schuyler. One of the parents asked Schuyler what affect would dropping men’s soccer and track (the school’s #1 and #2 sports team GPAs) have on the overall Richmond sports team GPAs. Schuyler said “none.”
How is it possible that dropping your school’s #1 and #2 GPA teams would not affect the University’s overall GPA? The only way this could be possible is if the school was projecting men’s varsity lacrosse to post a team GPA that was at least as high as soccer and track?
When the parent then asked how the Sports Mix committee projected a team GPA for the incoming men’s varsity lacrosse team, Schuyler said the committee used the GPA of the University’s women’s varsity lacrosse team.
Perhaps a better approach would be to use the cumulative GPA of the Richmond men’s club lacrosse team? To this suggestion, Ms. Schuyler said that wouldn’t be a fair comparison. The amount of time a club team member must dedicate to his sport is not as significant as the time commitment required by a varsity athlete (like a varsity soccer or track member). As such, given an apples to apples comparison, one would expect a club team member’s GPA to be higher than a varsity team member’s GPA because the club team member has more time to study.
Point taken, and a nice gesture on the part of the Sport Mix committee to weigh all the variables in order to arrive at a fair comparison. All the same, the soccer parent requested to see the cumulative GPA of Richmond’s club lacrosse team for the past two years. Alas, the University will not provide that information.